Optical Power Budget
Calculation of attenuation along the fiber and calculation of optical power
budget is made on Attenuation tab within OTDR Trace window.
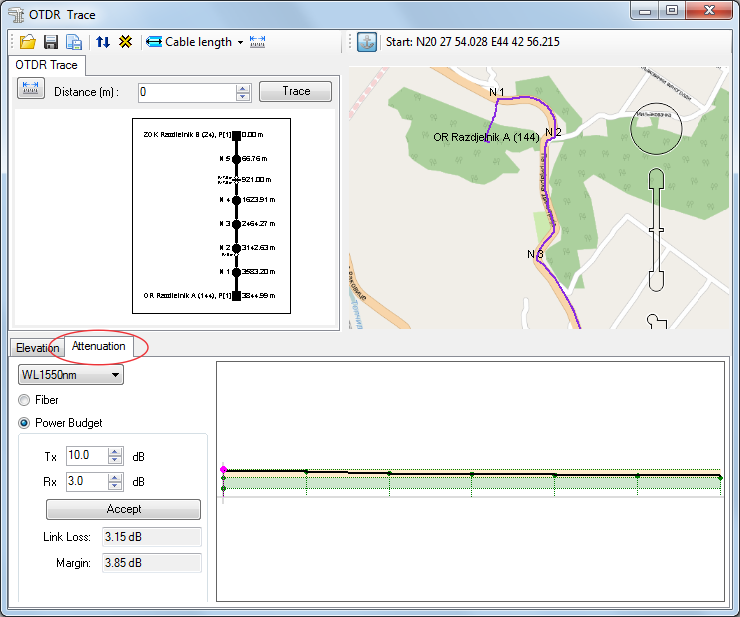
Figure 1
Tab: Attenuation
On the left side of the tab there are settings based on which the calculation is made.
On the right side there is a graph showing attenuation (in case of attenuation calculation) or signal power (in case of power budget calculation) given in decibels, for every point along the observed fiber.
Settings
Drop-down list:
From the drop-down list select the wavelength for which the calculation is made.
Radio buttons serve to select whether it will be attenuation calculation or power pudget calculation.
For power pudget calculation there are additional parameters used during
calculation.
(Nevertheless, they are active even during attenuation calculation but
do not affect the calculation itself.)
The additional parameters are:
- Tx field where the transmitter power output is entered
- Rx field where the receiver sensitivity is entered
Accept button makes the calculation based on given parameters.
The calculation result is written in the following fields:
- Link loss - total attenuation along the fiber
- Margin - remaining power (in relation to receiver sensitivity)
The result is also displayed graphically.
Graph
The graph shows the calculation result in a graphical form.
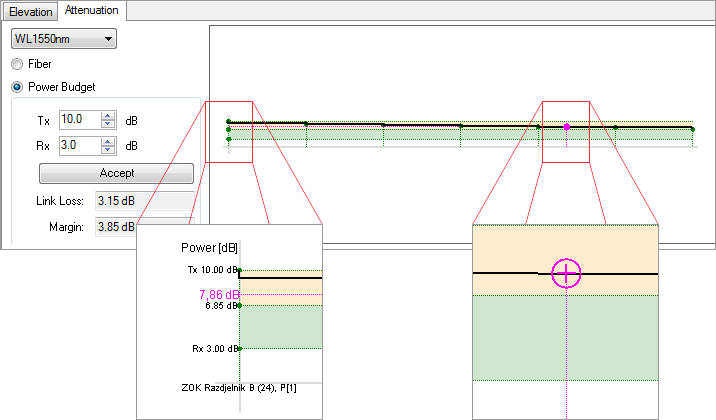
Figure 2
X-axis
Fiber nodal elements are shown along X-axis (horizontally) (the distances between them are schematic).
Y-axis
In case of power budget calculation, the values of optical signal power
are displayed along Y-axis (for any point along the fiber, not necessarily
a nodal element).
In case of attenuation calculation, total signal attenuation for the observed
point is displayed along Y-axis (vertically) (for any point along the
fiber, not necessarily a nodal element).
The result is displayed when the cursor ( ) is moved
to the desired location.
) is moved
to the desired location.
It can be done in two ways:
- by moving (dragging)
- by left double-clicking on the desired location along the fiber, whether on the graph, schematic display of fiber on map
When power budget calculation is made, total signal loss is colored light brown.
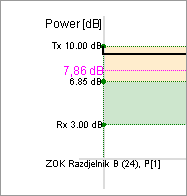
Margin is colored as follows, depending on whether it is positive or negative:
Figure 2a |
Figure 2b |
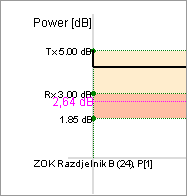
This provides the user with a fast estimate whether the transmitter and receiver can communicate via the observed fiber or it requires additional actions (increase of transmitter power or addition of amplifier, for instance).
Which factors affect the calculation?
The calculation is made based on set settings (as described earlier) as well as the following properties of fiber strand elements:
- length of individual fibers (in the cable) between the joints (nodal elements)
- attenuation along fiber strand between the joints
- connector losses
- losses at the joint of spliced fibers
Procedure
In Attenuation tab, the section with settings:
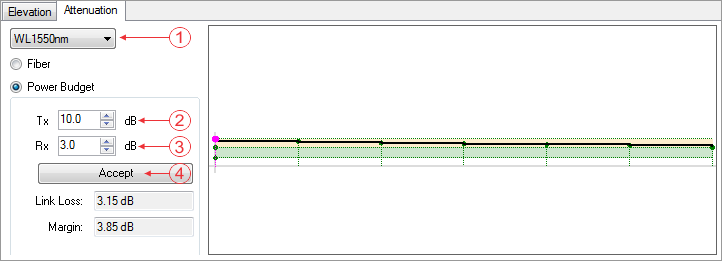
Figure 3
- select the wavelength for which the calculation is made,
- enter output transmitter power (dB)
- enter receiver sensitivity (dB)
- click Accept
The program makes the calculation and displays results while simultaneously generating the graphic display of results.