Display cables on the map
When you are in DB Optic View window, cables can be displayed in three different ways.
We do this by selecting the display mode from the  Display Mode drop-down menu.
You can choose one of three display modes:
- - Site Plan View
 - GIS View
  - Solve Overlapping
Site Plan View
This is the default cable display.
Cables are displayed exactly as they appear in GIS Database (Figure 1).
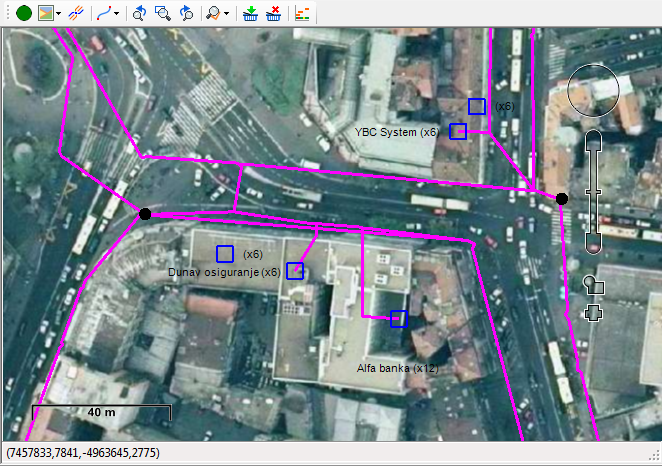
Figure 1
GIS View
When this display mode is selected, the routes along which the cables pass are reduced to one route (if they’re close enough to one another) (Figure 2).
In fact, it happens that the cables laid in the same trench are displayed as passing along different routes.
These routes are often just 10 cm away and by the rule there should be just one route between them.
This display mode approximates all those routes into a single one.

Figure 2
Solve Overlapping
In this display mode the cables are divided i.e. displayed so as not to overlap (Figure 3). This display mode enables us to easily find individual cables.
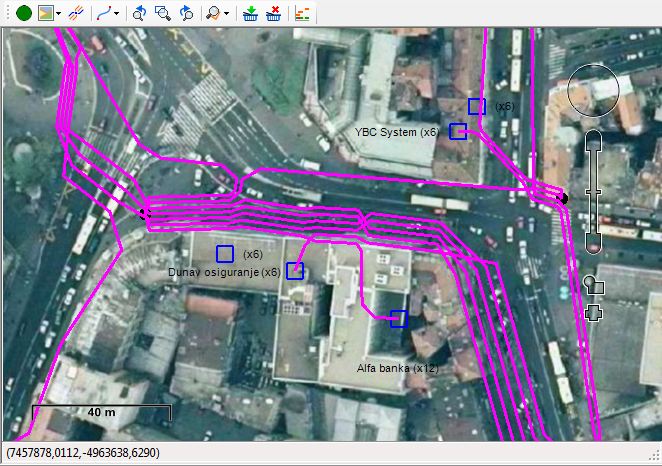
Figure 3