Windows: Statistics of...
There are 4 commands that practically open the same windows with statistical
data.
Window titles are different and depend on the command
, and in the case of command DT Area Capacity
data in the window are slightly different from the others.
All these windows display the same type of statistical data, the difference
is only in the number of NIDs included in the statistics.
Commands and window titles are as follows:
Command
|
Window title
|
Statistics refer to:
|
Users > Statistics
|
Selected NIDs
Statistics |
NIDs selected by the user |
Area > DT Area Capacity |
Selected DT
Area Statistics
(this window is slightly different from the others) |
NIDs within the selected DT areas |
Area > SA (serving area) Capacity
|
Selected SA
(serving area) Statistics |
NIDs within the selected SA (serving
area) |
Area > Project Area Capacity
|
Selected Project
Area Statistics |
NIDs within the selected project
area |
In further text we’ll describe only windows:
- Selected SA (serving area) Statistics
- Selected DT Area Statistics
Windows: Statistics of...
Windows contain four tabs:
- Calculate Capacity (the tab
where the data is different)
- Building Types
- NID types
- NID Status
In the bottom of the window there are two commands:
- Close
Closes the window.
 - New Area (or New Selection) - New Area (or New Selection)
Depending on which command opened the window, after clicking on icon, you can select the following in the site plan drawing:
- New NIDs (Users > Statistics
command)
- New DT Area (Area > DT Area Capacity
command)
- New SA (serving area) (Area > SA (serving
area) Capacity command)
- New Project Area (Area > Project Area
Capacity command)
After the selection, the window displays statistical data pertaining
to the selected NIDs.
Tab: Calculate Capacity
Tab layout differs depending on which command opened the window.
Window
layout (Figure 1) opened by command:
|
Window layout (Figure 2) opened
by command:
- Users > Statistics
- Area > SA (serving area) Capacity
- Area > Project Area Capacity
|
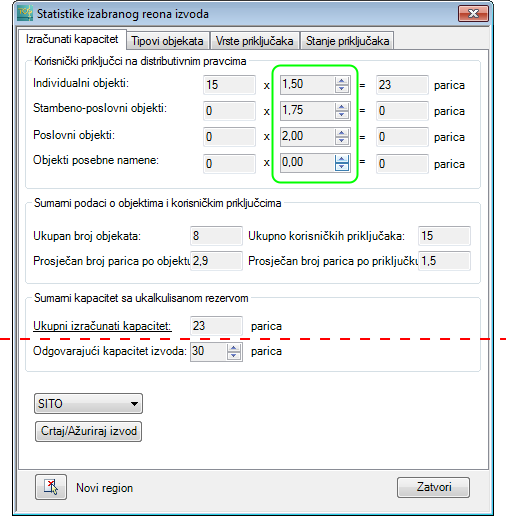
Figure 1 |
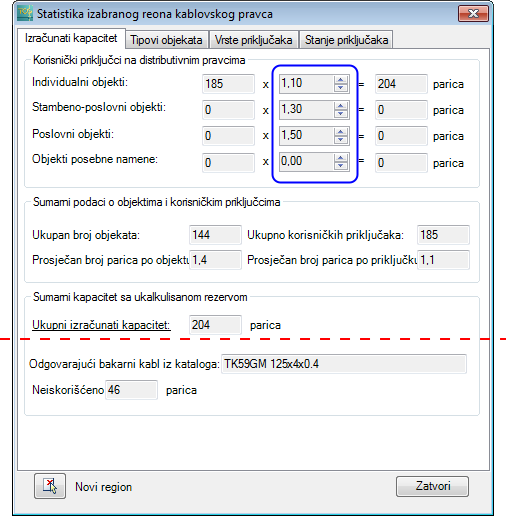
Figure 2 |
All fields above
the red dotted line are the
same, only the capacity increase
coefficient
fields (framed by green and blue) are completed with a variety
of data (Figures 1 and 2).
Capacity increase coefficient fields are completed with data
predefined by the System
Settings related to NIDs.
(Fields below the red dotted
line are different and they will be considered later in the text.)
| Clarification: |
|
|
When the window is
opened by command
Area > DT Area Capacity
, capacity increase coefficients are taken from the “Reserve
at
Drop Plant" (System Settings) section. |
|
Capacity increase coefficients
for all other commands
are taken from the “Reserve at
Distribution Network” (System Settings) section.
|
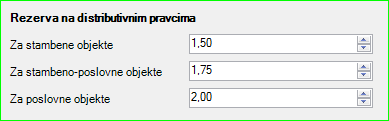
Figure 3 - (Coefficients from the system
settings) |
|
Figure 4 - (Coefficients from the
system settings) |
|
Tab layout: Calculate Capacity
Calculate Capacity tab is divided
into following sections
- NIDs on drop plants
- Summary data about the objects and NIDs
- Summary capacity with accrued reserve
NIDs on drop plants
|
This
section contains fields with the number of users (subscribers).
The fields are classified according to the purpose of buildings
with NIDs.
Values of these fields are the first input data and are obtained
by selection in the site plan.
Second input data are the coefficients for capacity increase.
They are taken from the "System Settings".
Multiplying the number of users and the corresponding coefficient,
we obtain the necessary capacity. |
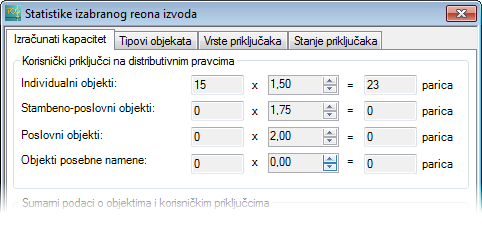
Figure 5
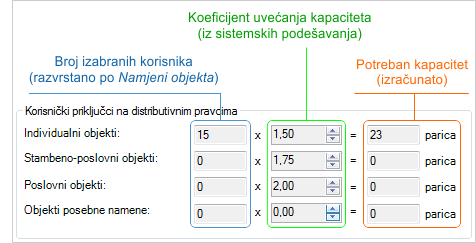
Figure 6 |
Summary data about the objects and NIDs
|
These
data were derived using data from the previous section
The section contains the following fields:
- Total number of objects
Total number of TCG objects selected in the site plan which
have users (subscribers).
They can be:
- NID (aerial line)
- NID (buried line)
- Building Entrance DT
- Wall-mount DT (out)
- Average number of twisted pairs in the building
- Total NIDs
Total number of subscribers on all selected TCG objects
- Average number of twisted pairs per NID
|
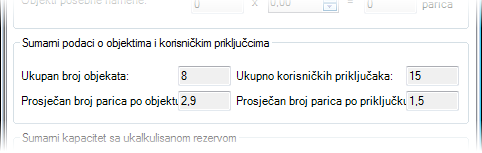
Figure 7 |
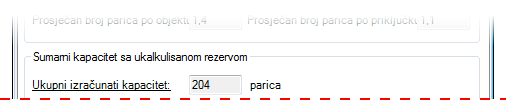
Summary capacity with accrued reserve
|
The section contains
the following fields:
- Total calculated capacity
- This is the total capacity, together with reserves obtained
based on the coefficient of capacity increase.
|
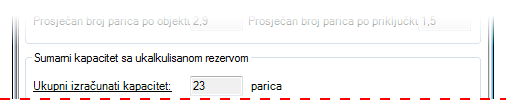
|
|
|
From
this point, fields of window opened by command Area
> DT Area Capacity are different compared to other windows. |
|
Area >
DT Area Capacity
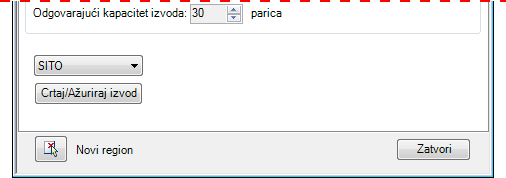
Figure 8
|
(Other
windows)
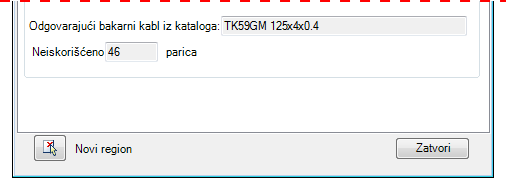
Figure 9 |
- Appropriate DT capacity
- This is the calculated capacity that the DT must have in
order to satisfy all users within the DT area.
Reserve obtained on the basis of the capacity increase coefficient
is accrued in the capacity.
In this case,
(under the section "Summary capacity with accrued reserve")
there is also a button Draw/Update DT
and the drop-down list from which you choose the DT type.
Their use is described on DT
Area Capacity page. |
- Appropriate copper cable from the catalog
- Copper cable with capacity that meets the calculated required
capacity. Cable of standard capacity is taken from the catalog.
Cable type, twisting and diameter are determined based on
System Settings, and the capacity is equal or the first higher
cable capacity in relation to the calculated capacity.
- Unused [number]
twisted pairs
Difference between the capacity of the selected cable and the
calculated capacity.
|
Tab: Object Types
The first chart shows the representation
ratio of object types in which NIDs are located.
The second graph shows the range of number of users per objects.
On each of the charts you can apply the following commands:

Copies the chart to the computer’s working memory.
The chart can later be
placed in Word, Excel, etc. using the command “Paste”.

Saves the chart as JPG file (figure). |
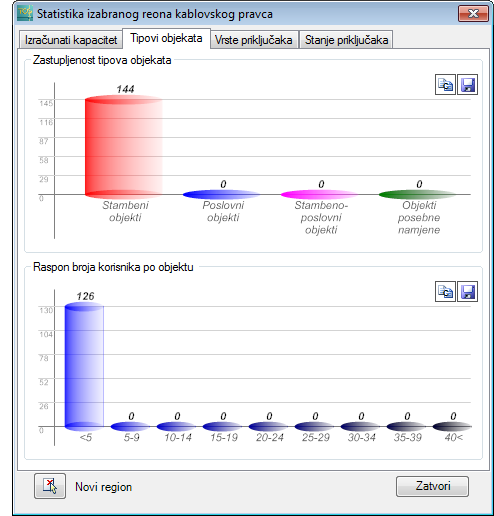
Figure 10 |
Tab: NID types
The second chart shows the
ratio of the number of users, classified by NID type.
The second chart shows the ratio of the number of users, classified
by NID aerial and NID buried line type.
On each of the charts you can apply the following commands:
Copies the chart to the computer’s working memory.
The chart can later be
placed in Word, Excel, etc. using the command “Paste”.
Saves the chart as JPG file (figure). |
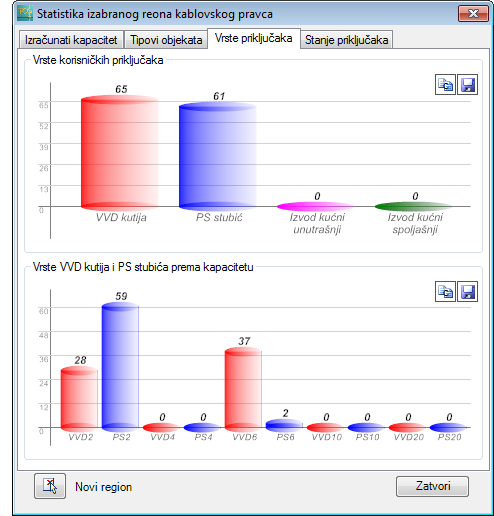
Figure 11 |
Tab: NID Status
The first chart shows the relation
between the number of planned and number of existing NIDs.
The second chart shows the relation between the number of direct
and shared line NIDs.
On each of the charts you can apply the following commands:
Copies the chart to the computer’s working memory.
The chart can later be
placed in Word, Excel, etc. by command “Paste”.
Saves the chart as JPG file (figure). |
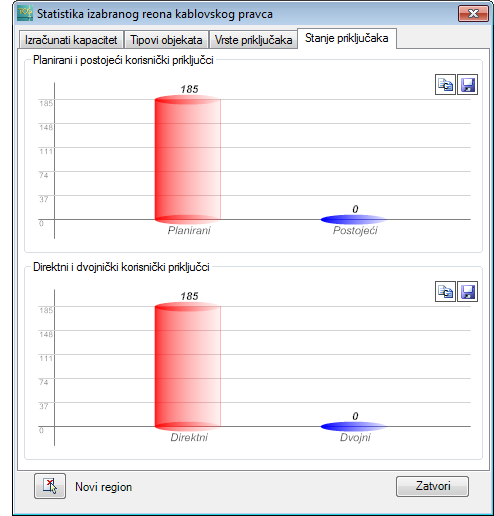
Figure 12 |
|