Conduit Network Schema Docker
Docker window is used to analyse conduit network,
trace available path between manholes, generate cross-sections, mark congested
ducts, etc.
It is opened by clicking on Show Docker ( ) icon.
(The icon is located on the main tollbar of Conduit
Network Schema window.)
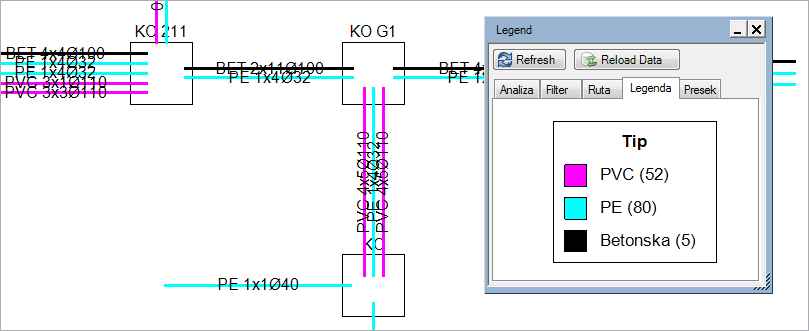
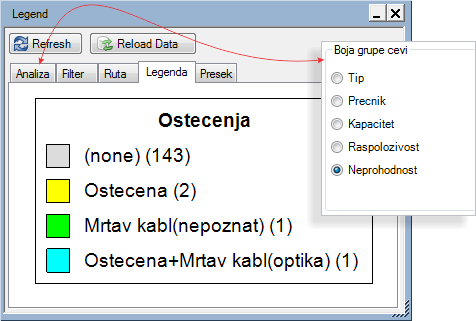
Figure 1 - The schema with the opened Docker window (the Legend tab is opened and it interprets the meaning of colors used when analyzing the network according to duct type).
Docker window has two buttons:

Refresh button refreshes the schematic display and Legend tab.
It must be run every time after the changes are made on Analysis and Filter tabs.

Reload Data button reloads the topology from the site plan drawing, after which the scheme shows the current status (as it is on the site plan drawing).
Below the buttons the window contains the following tabs:
- Analysis - (enables overview of conduit network infrastructure colored according to various properties)
- Filter - (defines criteria based on which certain parts of duct bank are shown or not)
- Route - (finds available path between the given points (also takes into account the criteria defined on Filter tab))
- Legend - (interprets the meaning of colors used in the schema)
- Cross-section - (generates and displays the trench cross-section on the selected route segment)
Analysis
Analysis tab colors conduit network segments
according to various duct bank properties.
By selecting a radio button in front of a certain item, the property which
determines the color of the conduit network segment is selected (Figure
2).
In this manner the conduit network can be analyzed very quickly.
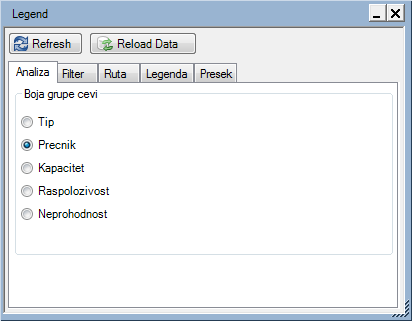
Figure 2
It is important to bear in mind that, in doing so, criteria defined on Filter tab will also be taken into account.
Analysis tab has the following radio buttons:
- Type
- Diameter
- Capacity
- Availability
- Impassability
Type
If this item is selected, the duct segments shown in the schema will
be colored according to duct types (PVC, PE, concrete, etc.). The colors
are assigned automatically.
Legend tab explaines the meaning
of used colors (e.g. red = PVC).
Diameter
If this item is selected, the duct segments shown in the scheme will
be colored according to duct diameter (Ø30, Ø50, Ø110, etc.).
The colors are assigned automatically.
Legend tab explaines the
meaning of used colors (e.g. red = Ø110).
Capacity
If this item is selected, the duct segments shown in the schema will
be colored according to the capacity of individual group (i.e. according
to the number of ducts within the duct group). The colors are assigned
automatically.
Legend tab explaines the
meaning of used colors (e.g. red = PVC 2X1 Ø110).
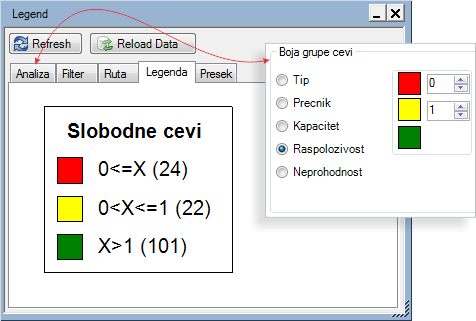
Availability
If this item is selected, the duct segments shown in the schema will
be colored according to the number of free ducts within the group (i.e.
according to the number of free ducts within the duct group).
There are three levels of availability. The users themselves define maximum
and minimum number of free ducts for each level.


Impassability
The duct segments shown in the schema will be colored if at least one
of the ducts within the duct segment is marked as damaged
or ocupied with an abandoned cable. Other duct segments will be colored
gray.
Legend tab explaines
the meaning of used colors (e.g. yellow = damaged).
Impassability can be defined using Cross-section command.
Filter
Filter tab contains several criteria by
means of which we define what will or will not be shown in the schema
(Figure 4).
(What is not shown will not be taken into account while tracing
available path.)
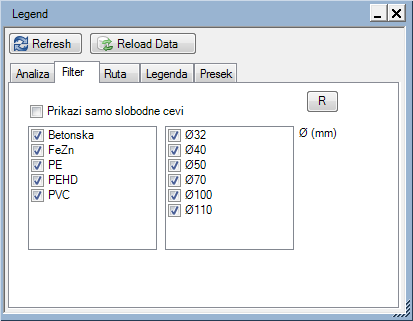
Figure 4
The criteria are as follows:
- Show Free Ducts
Only
If this item checkbox is checked, the duct segments which do not contain any free ducts will not be shown in the schema. (The duct can be occupied with active cable (cable laid on the site plan or GIS database), occupied with other duct or marked as damaged or ocupied with abandoned cable) - Duct Type Frame
The frame shows all duct types detected in the schema. By default, all of them are checked, which means that the duct segments with ducts of this type are shown in the schema. When we wish to hide duct segments of certain duct type, we need to uncheck the checkbox in front of that type.
- Duct Diameter
Frame
The frame shows all duct diameters detected in the schema. By default, all of them are checked, which means that the duct bank segments with ducts of these diameters are shown in the schema. When we wish to hide duct segments of certain duct diameter, we need to uncheck the checkbox in front of that diameter.
Trace
Trace tab enables finding available path (i.e. finding free ducts) between the points set by the user (Figure 5).
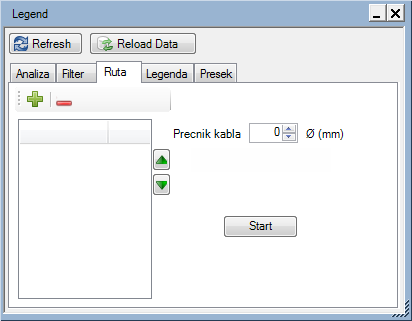
Figure 5
While finding available path, the program takes into account the criteria
defined on Filter tab. In other words, if
during the trace a duct bank segment is not shown in the schema, it will
not be taken into account while finding available path.
(It is possible to, for instance, turn off all the innerducts. The program
will then search for available path through the ducts of other types).
The command is described in detail on Trace Available Path page.
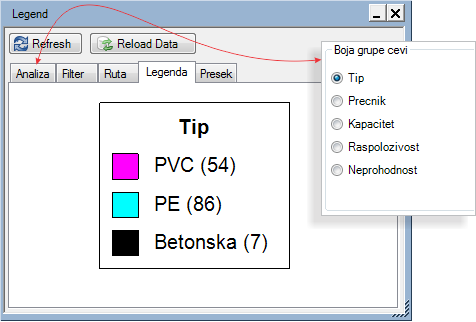
Legend
The legend explains the meaning of colors used for duct segments in
the schema.
The legend refers to the properties selected on Analysis
tab.
Type
The legend shows all duct types detected in the schema. The following are shown from the left to the right:
|
Figure 6 |
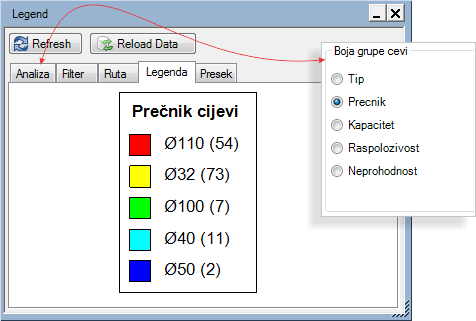
Diameter
The legend shows all duct diameters detected in the schema. The following are shown from the left to the right:
|
Figure 7 |
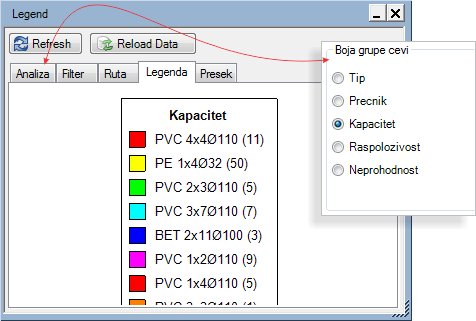
Capacity
The legend shows all duct capacities detected in the schema which are additionally divided by duct types and diameter. The following are shown from the left to the right:
|
Figure 8 |
Availability
The legend shows levels of duct availability. The users themselves define maximum and minimum number of free ducts for each level. The following are shown from the left to the right:
|
Figure 9 |
Impassability
The legend shows damaged ducts and
|
Figure 10 |
Cross-section
Figure 11 |
|
Figure 12 |
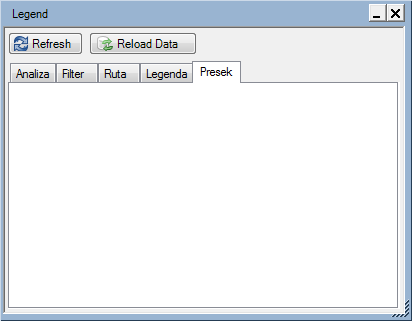
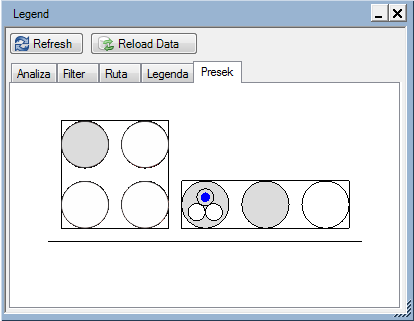
Cross-section tab shows the cross-section of duct segments.
Initially, the tab is empty, i.e. it does not show any of the cross-sections.
This is because none of the cross-sections have been created yet.
The cross-section is created on the schematic display, by running Cross-section command from the context menu,
which is opened by right-clicking on the place where we want to create
the cross-section.
The procedure of creating cross-section and its additional functions are described on Cross-section page.