Window: Conduit Network Schema
Conduit Network Schema window shows all the
elements of conduit network which are present the site plan drawing.
The elements (duct bank, innerducts, manholes, crossing ducts) are displayed
schematically. Schematic diagram is generated automatically.
The schematic display is used to overview infrastructure, perform various analyses, find an available route, generate cross-sections, etc.
Navigating the schema
Navigation through the schema is done using mouse wheel or navigation
tools in upper right corner of the schema workspace.
The mouse is used in a standard manner:
- By scrolling the mouse we zoom in and out
- By pressing the mouse wheel, the schema workspace is moved (pan)
- Double-clicking on the mouse wheel shows the whole schema (zoom extend)
- If multiple schema elements are selected (using selection window),
then, by pressing left mouse button and dragging cursor to the left,
all the encircled elements will be selected as well as those touched
by the window outline.
If the cursor is dragged to the right, only those elements completely encircled by the window outline will be selected. - Multiple elements at once can be selected by left-clicking on them while SHIFT key is pressed.
Toolbar
The schematic display has its own toolbar with the following tools:
- Drop-down list
for selection of schema display mode (elaborated further on here):
 - Show Docker -
Shows the docker with a legend. In “Conduit Network Analysis” mode,
it also shows additional tabs (tools) (explained in detail on Docker
page)
- Show Docker -
Shows the docker with a legend. In “Conduit Network Analysis” mode,
it also shows additional tabs (tools) (explained in detail on Docker
page) - Increase Distance between
Elements - Moves apart the schema elements for better visibility
and is used if there are a lot of elements in the schema
- Increase Distance between
Elements - Moves apart the schema elements for better visibility
and is used if there are a lot of elements in the schema - Reduce Distance between
Elements - Moves the schema elements closer together
- Reduce Distance between
Elements - Moves the schema elements closer together - Turn off Filter
- Cancels all the applied filters, i.e. shows the complete schema
(with all the elements)
- Turn off Filter
- Cancels all the applied filters, i.e. shows the complete schema
(with all the elements)
(filtering is made by using filters on “Filter” tab of the docker or using the context menu (eight click menu)). - Last Loaded Element
- Highlights the element that has been last loaded from the data base.
- Last Loaded Element
- Highlights the element that has been last loaded from the data base.
(The command is inactive in this window) -
Export to Block - The command is described in detail on Command:
Export to Block page (it is used for printing)
-
Export to Block - The command is described in detail on Command:
Export to Block page (it is used for printing)
Schema display modes
There are 3 schema display modes.
In one of them, which is:
- Edit Schematic Diagram,
the schema geometry can be edited, and the other two:
- Conduit Network
- Conduit Network Analysis
are used to navigate the scheme, overview infrastructure, various analyses, trace available path, generate cross-sections, etc.
Mode: Edit Schematic Diagram
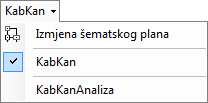
By selecting the Edit Schematic Diagram
item from the drop-down list on the main menu, we switch to the mode where
we can adjust the schema geometry according to our needs.
Changes made in this mode will reflect upon the two remaining modes (Conduit
Network, Conduit Network Analysis).
This procedure is described in detail on Edit Schematic Diagram page, which explains the procedure when we work with the fiber optic network. The procedure is similar when we work with the conduit network, but in this case manhole is the only nodal element we operate with.
Mode: Conduit Network
By selecting Conduit Network item from the drop-down list, the mode in which the conduit network segments are shown in the scheme becomes active (Figure 1).
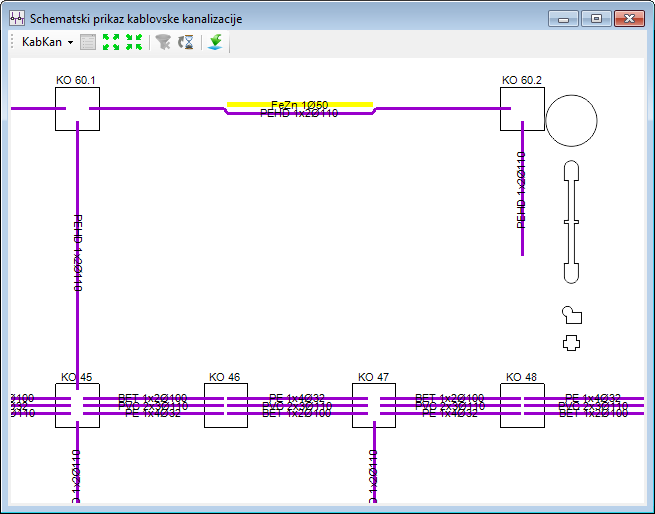
Figure 1
Conduit network segments are displayed with the same default colors
as in the site plan drawing,
and in the right bottom corner the docker
window with legend is initially shown (Figure 2)
(if we turn off the docker, it can be reopened by clicking Show
Docker icon ()).
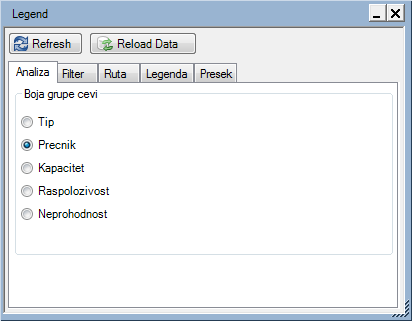
Figure 2
Context menu commands:
Right-clicking on any conduit network segment will open the context menu with commands which are the same as those in "Conduit Network Analysis" mode (see below).
Mode: Conduit Network Analysis
By selecting Conduit Nerwork Analysis item from the drop-down list we activate the mode in which, by using tools from the Docker, we can analyze the conduit network, find available route, generate cross-section, etc. (Figure 3)
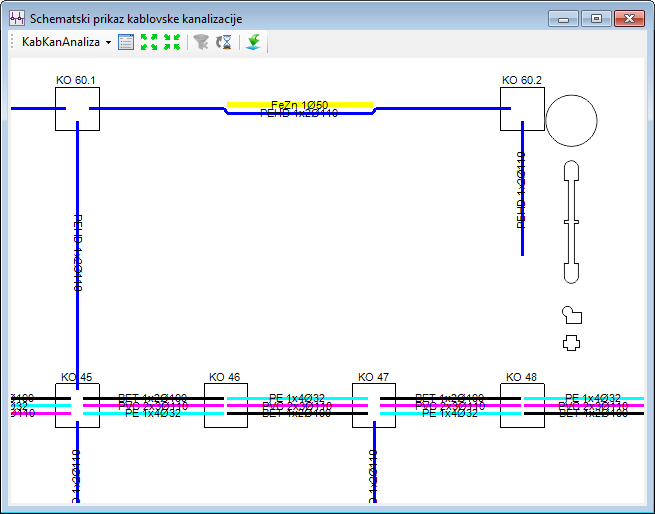
Figure 3
For more details go to the following pages:
Context Menu Commands
Right-clicking on any conduit network segment can run the following commands:
- Show in Site
Plan
Shows and selects the selected conduit network segment on the site plan drawing. - Cross-section
Creates the trench cross-section (the Cross-section tab of the Docker).
Cross-section has various functions which are described in detail on Cross-section page.
Right-clicking on any manhole can run the following commands:
- Show in Site
Plan
Shows and selects the selected manhole on the site plan drawing. - Open Manhole
Opens Manhole Butterfly Diagram where the arrangement of the infrastructure elements is made.