Edit Schema Display
Mode: Edit Schema Display
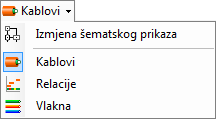
By selecting Edit Schema Display from the drop-down list, enter the mode for adjusting the schematic diagram according to your own needs. (Figure 1)
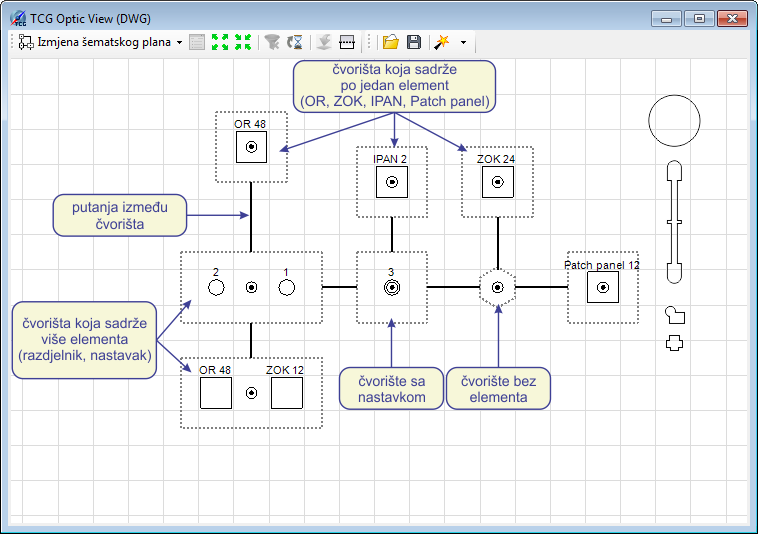
Figure 1
Changes made in this mode will be reflected in other three modes (Cables,
FO Paths and Fibers).
In this mode, we change the geometry of the schema elements.
In this mode you can’t see cables nor fibers but only the junctions (with or without the nodal elements) and paths along which the cables (i.e. fibers) pass.
Junctions
Essentially, junctions are locations where one more nodal elements are placed or a location where cables branch even without nodal element being present.
Junctions can be moved across the workspace. Their position is determined
by orthogonal network, i.e. wherever we put the element it will be located
in the center of the nearest network rectangle. This method ensured that
everything goes smoothly.
You can change the dimensions of junctions. There may be multiple nodal
elements (e.g. splice points) in a single junction.
In this case, the splice points can be spaced apart so as not to overlap.
To make this possible, the change of junctions’ dimensions is enabled.
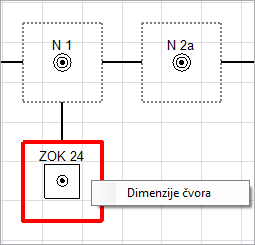
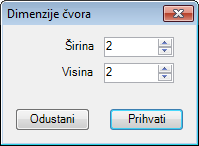
Dimensions of junctions are changed by right-clicking on them to run Junction Dimensions (Junction size) command
(Figure 2), after which the Junction
Dimensions window opens. (Figure 3). You can set the width and
height of the junction in it.
Figure 2 |
|
Figure 3 |
Paths
Paths between junctions can also be edited. You can add vertexes to
the paths.
Double-click on an empty spot on the path to add a new vertex (displayed
as a yellow dot (Figure 4)).
Double-click on an existing vertex to remove it. Vertex position is also
conditioned by the orthogonal network.
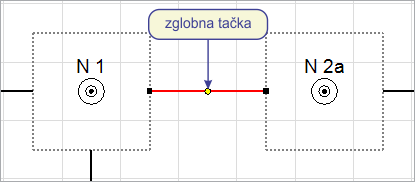
Figure 4
By moving the vertexes we change the geometry of the path.
The start and end point of the path can not be changed, they are attached
to the junctions and move along with them.
Toolbar
Toolbox contains tools, some of which are the same as in modes (Cable / FO Paths / Fibers):
- Drop-down list
from which we select the scheme display mode (explained in more detail
on Fiber Schema page):
 - Show Docker
The command is in this case inactive.
 - Increase space between
elements
- Increase space between
elements
Moves apart elements of the schema to improve the clarity, we use it if there are a lot of elements displayed
 - Reduce distance between
elements
- Reduce distance between
elements
Brings elements of the schema closer together.
 - Turn off Filter
The command is in this case inactive. - Last loaded element
Highlights the element that was last loaded from the database.
(The command is only active in the window DB Optic View.)
 - Export to block
This command is described on page Command: Export to block
(Command is active only in the window TCG Optic View (DWG).)
 - Manholes (display manholes mode)
This icon allows you to add manholes to the existing schematic diagram:- Remove manholes
Removes all manholes found in the schema. - Add only
manholes with optical elements
Only manholes containing some nodal elements of the FO network are added to the existing schema. - Add all manholes
through which the FO cable passes
All manholes through which FO cables displayed in the schema are passing are added to the existing schema.  - Select the element you want to locate in the schema:
Allows you to locate the object in the schema by selecting that same object in the site plan drawing, i.e. navigating the scheme using the site plan drawing.
By clicking on an element in the site plan drawing, that same element is selected in the schema. This tool is fully operational in "Cables" and “FO Paths" modes (you can locate both cables and nodal elements), while in the "Edit schema display" mode you can locate only nodal elements. You cannot use this tool in “Fibers" mode .
Other tools are unique to this mode:
 - Open Schema
Opens (loads) the schema which was previously saved as *.ischX file
 - Save Schema
Saves the current schematic diagram in the current DWG file, and offers as an additional option to save scheme as *.ischX file
 - Automatic generation of
schema (with the choice of schema generation method):
- Automatic generation of
schema (with the choice of schema generation method):
 - Main branch rule
The scheme will be generated under the "Main branch"
rule.
- Main branch rule
The scheme will be generated under the "Main branch"
rule.
 - Geometric
The schema aspires to reflect the geometry of the network from the site plan drawing as much as possible. - Large Schema
This method is primarily aimed at generating schematic diagrams with an extremely large number of elements. - Ignore points of
cable separation
- Ignore points of
cable separation
(currently in the experimental stage and has no effect.)
Unlike the previous three items, this is not the method for generating schemas but a rule to be applied when generating schemas (by any of the three abovementioned methods). When enabled, the schema displays points where the cables are separating or intersecting, even if there are no nodal elements in these locations, otherwise the schema gets even more simplified.